Gantt
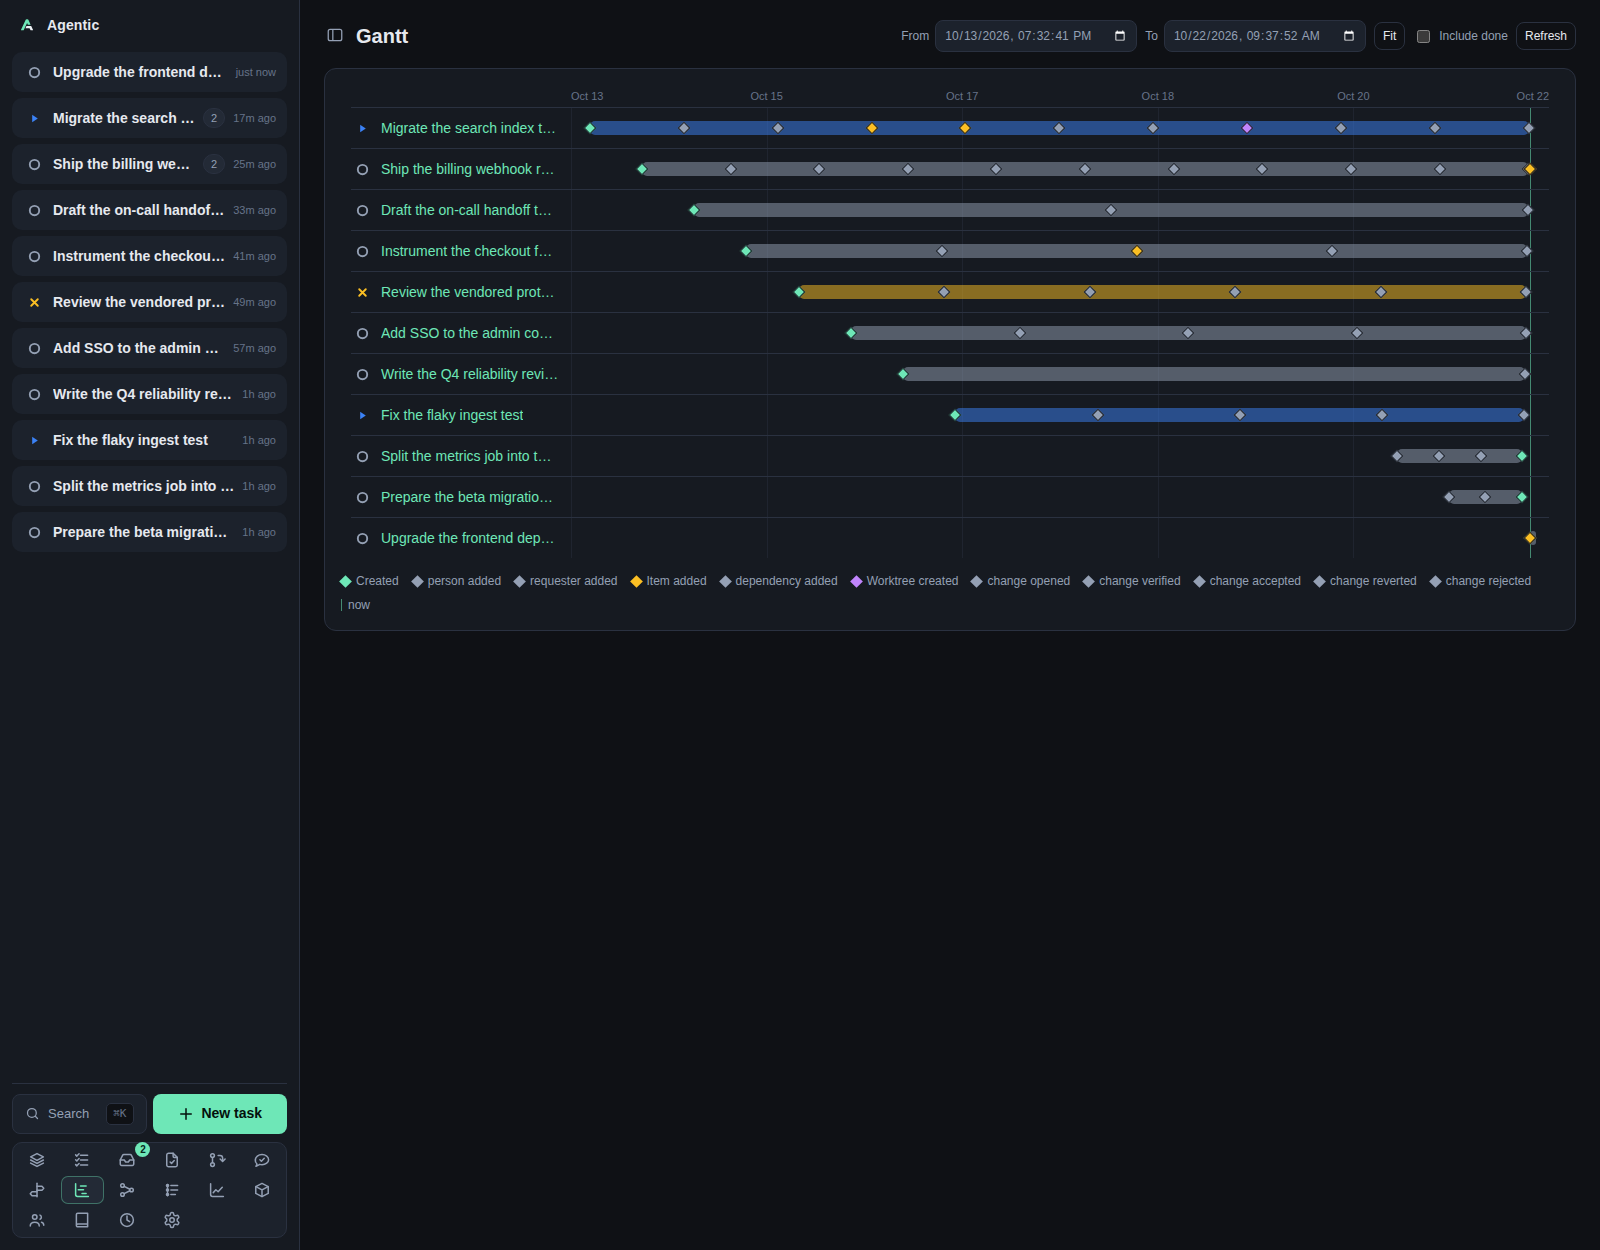
/gantt shows every task in flight as a bar on a time axis, with one marker per timeline event.
Problem
A list of tasks hides how long they have been open and when things actually happened. The Gantt puts every in-flight task on one axis, so you can see what started when, what is still moving, and where activity clustered. Markers are the task's timeline events, so the chart is a history as well as a schedule.
How to use it
The page
The header has From and To datetime fields, Fit, an Include done checkbox, and Refresh.
Below it, one panel holds the chart.
Each row shows the task's status picker and its title on the left, and on the right a track with tick gridlines, an optional now line, a bar from when the task was created to when it was last updated, and markers.
Hovering a marker shows its label, its timestamp, and its message.
The legend below the chart lists the marker kinds present, plus now when the current time is in view.
The time window
From and To start fitted to the data and stay fitted until you edit either one.
Editing a field pins the window, and refreshes stop refitting until you press Fit.
Fit recomputes the window from the data: every task's created and updated times, every marker, and the current time, with a small padding and a minimum span of one minute.
The pinned window is lost when you leave the page.
Ticks adapt to the span: six labels normally, four with times of day when the span is under three days, and three in a compact chart.
Controls
| Control | What it does |
|---|---|
Include done |
Adds done and archived tasks. Off by default. |
Refresh |
Reloads the chart. |
| Row status picker | Changes the task's status. Saves immediately and rolls back on failure. |
| Row title | Opens the task page. A click on the status picker does not follow the link. |
An end date before the start date shows End must be after start. Showing the fitted range. and falls back to the fitted window.
Good to know
- Nothing polls; the chart loads on mount and when you change the window,
Include done, orRefresh. No tasks in flight. Create one to see it here.is the empty state, so a filtered window with nothing in it looks the same as an empty database.- The task page's own timeline panel shares the chart code, so a marker looks the same in both places.
CLI and agent interface
There is no Gantt command; the data is one read.
| Operation | CLI | HTTP |
|---|---|---|
| Read the chart data | none | GET /api/gantt?include_done=true |
| Change a task's status | agentic task update <task> --status in_progress |
PATCH /api/tasks/{id} |
| Read one task's events | agentic task timeline <task> |
GET /api/tasks/{id}/timeline |
The endpoint returns tasks oldest first, each with all of its timeline events and its created and updated times.
The window, Fit, and the legend are computed in the browser, so an agent has to do its own filtering.